Relative Strength Index (RSI)

What is RSI?
The Relative Strength Index (RSI) is one of the most commonly used momentum oscillators for analysing a stock chart. It is called a momentum oscillator because it oscillates between 0 and 100. It measures the speed and magnitude by which the price of stock changes and indicates whether a stock is in its overbought or oversold situation. It is most useful when the price is non-trading or sideways. In simple words, when the price moves very fast in one direction, the RSI also tends to move very fast in the same direction, and when the price move in a sideways direction the RSI also starts to move in a sideways direction, indicating a sideways market.
The formula to calculate RSI is:
How does it work?
It compares a stock’s strength to the number of days it went up and the number of days it went down. For example, if you have set the RSI of a stock chart to 10, then it will be calculated as the market closed higher for 5 days (Average gain) and the market closed lower for 5 days (Average loss) in percentage.
Traders use this oscillator to take buy & sell positions in stock:
- when a stock is in an overbought or oversold situation
- when a stock indicates trend reversal or swing reversal
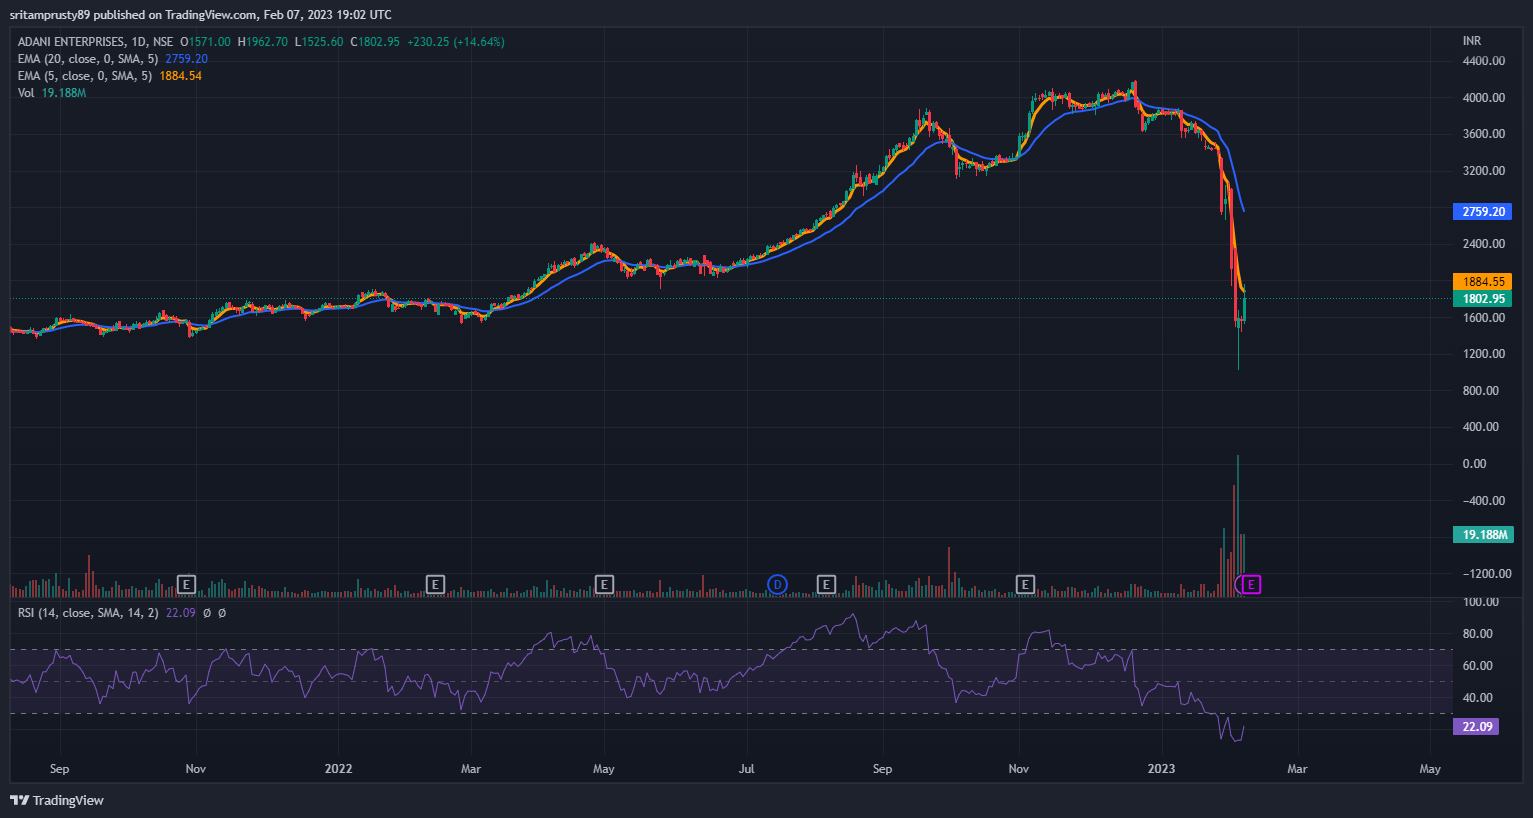
Since we have discussed the overbought and oversold situation too much, here is a glimpse of ‘How that situation looks like?’. Above we have shown you the chart of Adani Enterprise. In our example, when the RSI moves to the 70-100 zone, it is known as an overbought situation as the buyers have brought the price to this level. There is a good chance that the swing or the trend may change or give a sign of reversal. Similarly, when the RSI moves to the 30-0 zone, it is known as an oversold situation as the sellers have brought the price to this point, and there is a good chance that the trend may change, and the bulls can again take the price up.