Macro Lesson 1: What is IIP and how can it be used to predict the stock market?
Hey there,
Have you ever used macro indicators or a macro dashboard for your investing due diligence? I remember during my initial career in Equity Research, I used to get assigned with a task of creating a macroeconomic dashboard and updating monthly data in a sheet related to government yields of different countries, cement production, steel production, IIP data, motor vehicle sales, consumption growth, CPI & WPI inflation data, crude oil, and other commodity prices, etc. After collecting all this data from respective government websites, we had to analyze them to find opportunities in relevant sectors, and trust me, it was really easy and interesting. Many fund houses like Baroda BNP Paribas Mutual Fund release this macro dashboard for the public, which can be accessed from their website via the link: https://www.barodabnpparibasmf.in/insights/macroeconomic-dashboard
Before we discuss today’s topic of predicting the movement of the Indian Stock Market using the "IIP" economic indicator, let me introduce you to a small theory of "Harry Markowitz" - the Nobel-winning pioneer of the "Modern Portfolio Theory". That said, investors should diversify their portfolios with negatively correlated assets.
This means that if you have equity and debts, like two negatively correlated assets in your portfolio, if one asset's price falls, another asset gives the portfolio stability from severe impact. This is why diversification is done.
Now, you might be wondering, what does this correlation mean?
There are basically two types of correlation: one is positive correlation and another is negative correlation. The correlation varies from -1 to +1.
Positively correlated assets imply that if one asset class rises, another also rises, and if one falls, another also falls. In negative correlation, when one falls, another rises, and vice versa. Examples of negative correlation can include stocks and bonds, or stocks and gold.
Correlation not only exists between different asset classes but also among economic indicators and Stock Market. This means that by closely monitoring economic indicators, an investor may be able to predict whether the stock market will rise or fall.
Now, the question arises: why are these economic indicators related? How are they related? Let's understand them thoroughly.
Stock Market vs “Index of Industrial Production-IIP”
In this topic, we will only discuss the Indian equity market. Historically, it has been proven that investing in emerging countries generates multifold returns compared to developed economies in the long run. India is one of the fastest-growing emerging economies in the world. Therefore, knowing the economic indicators and their impacts will definitely give indian investors an upper hand.
Answering the question "Why are these economic indicators related to the equity/stock market?", the stock market is a reflection of actual happenings in the economy. The stock prices ultimately depend on the fundamentals and the real demand in an economy. If the demand is good in an economy, then corporate earnings grow, and so do the stock prices. This demand can be tracked through economic indicators like IIP.
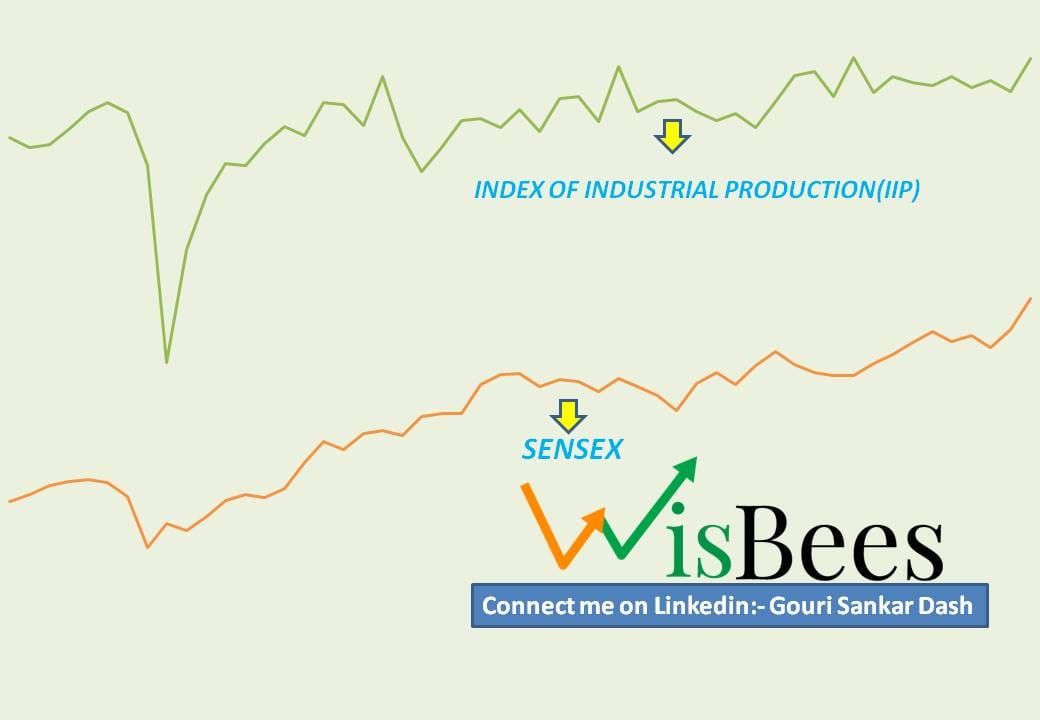
Although it is a very debatable topic among researchers whether economic growth indicators can predict market movements or not, most of the time, a clear visible relation is seen. Look at the comparison chart of "Sensex vs IIP" below.
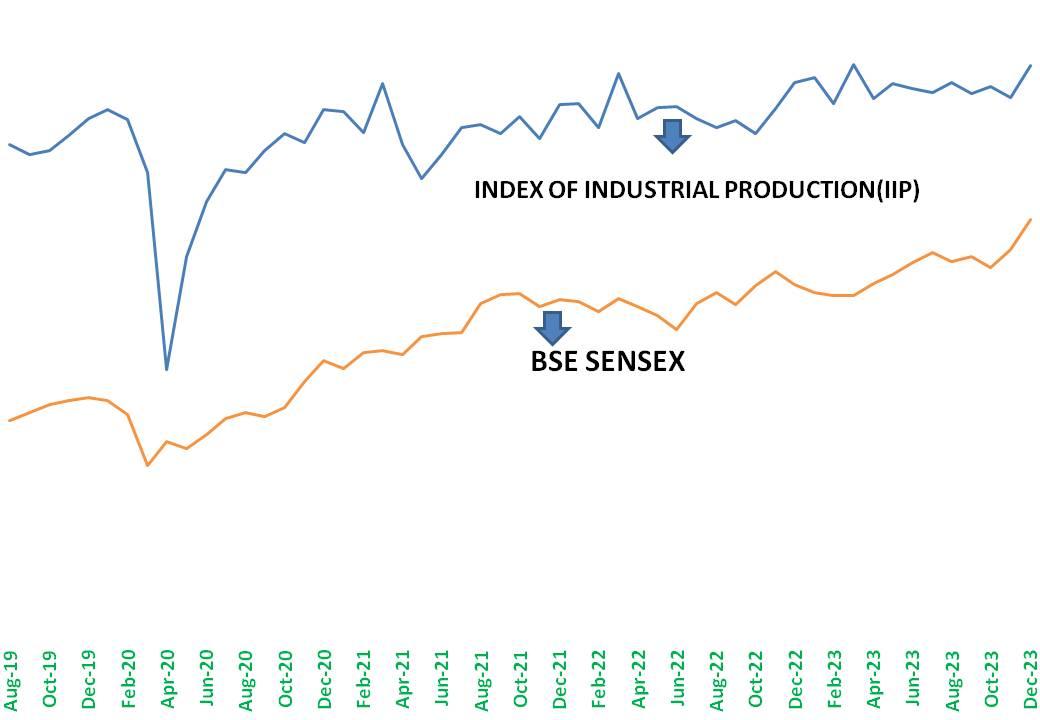
Here, we have demonstrated a correlation between the "Sensex" and the IIP within a randomly selected time frame from August 2019 to December 2023.
In this analysis, it is evident that the IIP generally acts as a leading indicator, with the stock market. The significant decline in the IIP during the COVID-19 pandemic was attributed to lockdowns and disruptions in the supply chain. However, this improved as circumstances evolved.
This data is publicly available via the link: https://mospi.gov.in/iip
Manufacturing constitutes the primary component of the “IIP” Index. This suggests that when manufacturing growth in India is strong, the Indian stock market is likely to perform well. Conversely, when manufacturing underperforms, the stock market tends to decline. For visualization purposes, we have utilised the monthly closing data of Sensex and IIP.
Introducing you to IIP:-
"IIP" denotes the Index of Industrial Production, a figure published by the Central Statistical Organisation (CSO) under the Ministry of Statistics and Programme Implementation every month. It shows the overall growth of industrial activity in the economy, encompassing sectors such as Mining, Manufacturing, and Electricity. One can also consider it a barometer for measuring production and capacity across key sectors.
IIP is calculated with respect to a Base year which is 2011-2012 now. The base year is assigned a value of 100. So If someone says that in December 2023, the IIP was 151, it means that industrial production has increased by 51% compared to the base year (2011-2012). This is the ninth revision of the base year since its inception in 1937.
A positive growth rate in the IIP indicates an expansion in industrial production, while negative growth suggests a contraction or decline. This growth or decline can be attributed to various factors in the economy, such as changes in consumer demand, monsoons, supply chain disruptions, government policies, and exports.
The IIP, or Index of Industrial Production, is broadly classified into two categories: Sectoral Classification and User-Based Classification.
Sectoral classification of IIP:-
It is broadly classified into three major sectors such as ➖
- Manufacturing Sector: This includes industries such as textiles, chemicals, machinery, automobiles, etc.
- Mining Sector: It includes coal mining, oil and gas extraction, metal ore mining, etc.
- Electricity Sector: It covers the generation, transmission, and distribution of electricity.
Out of the above three sectors, the Manufacturing sector has the highest weightage in IIP, followed by Mining and Electricity. The weightages are as follows:
User Based Classification of IIP:-
In addition to Sectoral classification, IIP can also be classified as per the user-based category, which categorises industries based on the type of goods produced. This classification includes:
- Primary goods
- Capital goods
- Intermediate goods
- Intermediate goods
- Consumer durables
- Consumer non-durables
Primary goods have the highest weightage in the IIP in this classification segment. These goods are directly obtained from natural sources and used for further processing and consumption in manufacturing and power-generating activities, for example, fuel, ores, minerals, and electricity.
How can Investors use it?
Higher IIP indicates strong manufacturing activity, which means a stronger demand for goods and services. This leads to strong top-line and bottom-line growth of companies, ultimately pushing stock prices higher.
Some sectors perform very well with an increase in IIP, while few underperform. To check the growth of each sector, you can visit this platform.
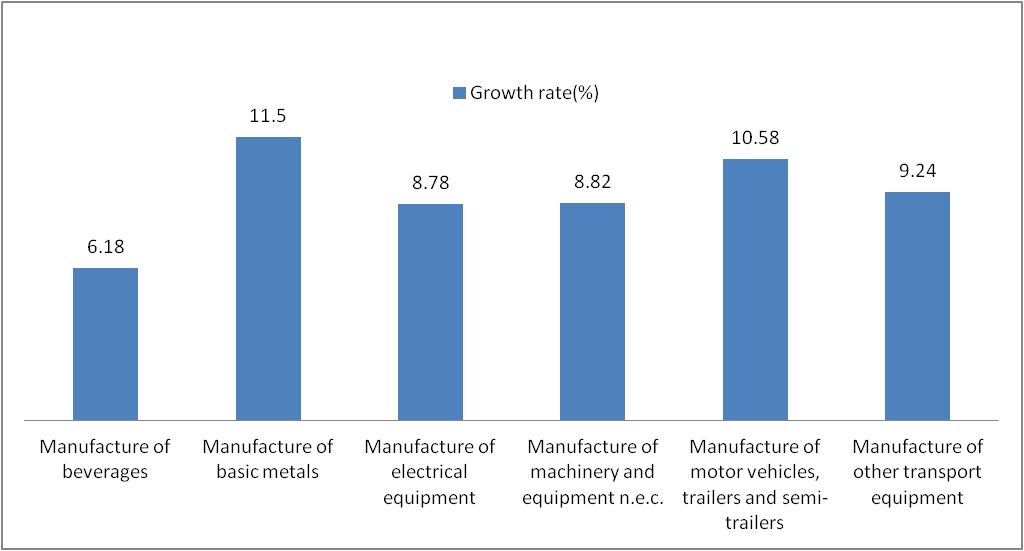
Below, we have attached a column chart of different sectors with the highest weights in IIP over the years. The base year is 2011-2012, and the assigned value to the base year is 100.
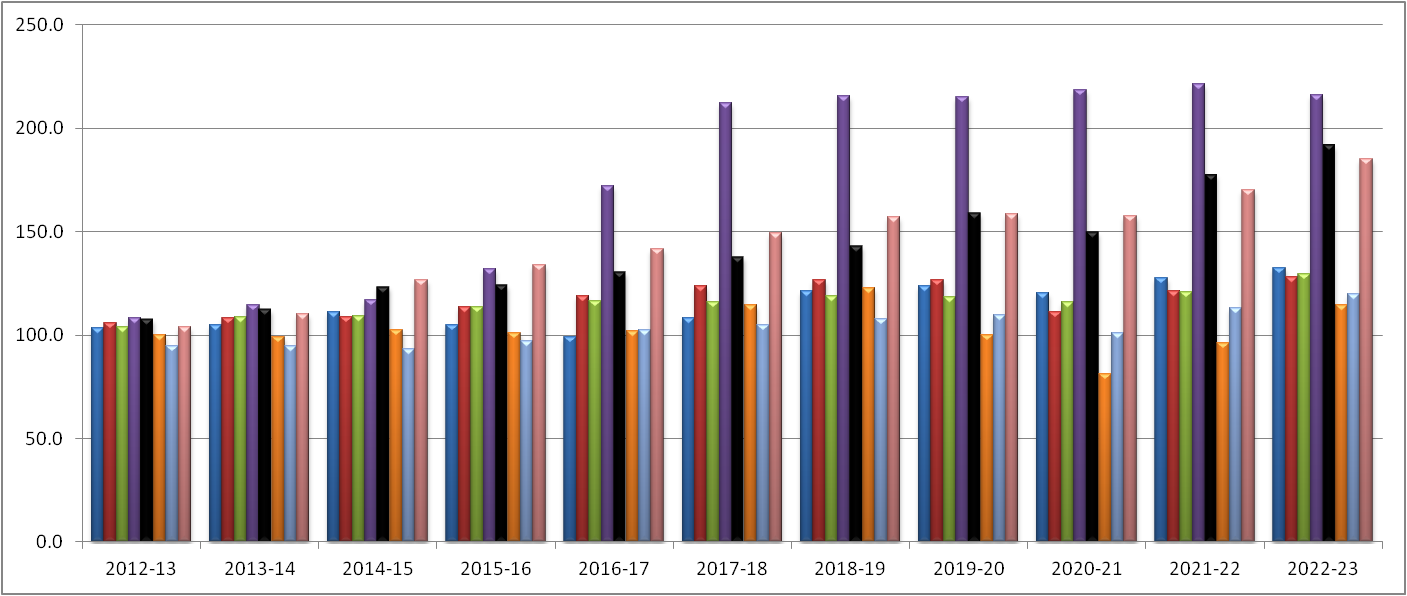
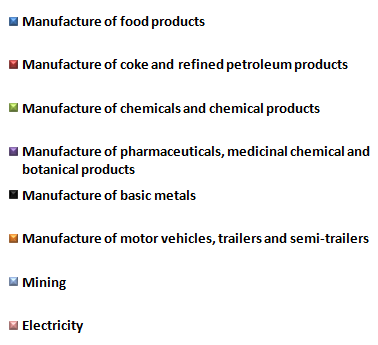
In the above chart, we can clearly see that some sectors have outperformed with their growth rates, such as the pharmaceutical and medicinal chemical segment. Additionally, manufacturing of basic metals has remained strong, along with electricity production.
When computing growth rates to the previous year, you will see that the manufacturing of motor vehicle segment has shown the highest growth rates in the last two years. As a result, we observed a strong rally in automobile stocks and significant inflows from Foreign Portfolio Investors (FPIs) into that sector. Similarly, all such industries can be analysed from the IIP database, and investment decisions can be made.
One can manipulate the data published by the IIP in the provided links using Excel and attempt to identify trends, such as the industries with the highest growth rates in a year, and find the best company in that industry to invest in. As I am writing this article in the first quarter of 2024 and want to examine where the highest growth was observed in 2023, I can calculate the following data. These are the top six sectors where the highest positive average growth was observed.
Now I can pick the best stocks to invest in from the above sectors as they have shown the highest growth among all other sectors. Similarly, we can also check the growth rate in user-based categories, where we can see that Capital Goods have shown the highest growth rate in the last year. This can be one of the due diligence techniques for an investor.
Overall, strong growth in IIP data shows a growing economy, which leads to strong corporate earnings growth and higher stock prices.
Now let's see how an increase in IIP has impacted the corporate earnings growth of the whole economy. We will take all the monthly closing prices of Sensex and multiply them by the PE ratios to find out the earnings of the Sensex over a time period. We will compare this with IIP growth.
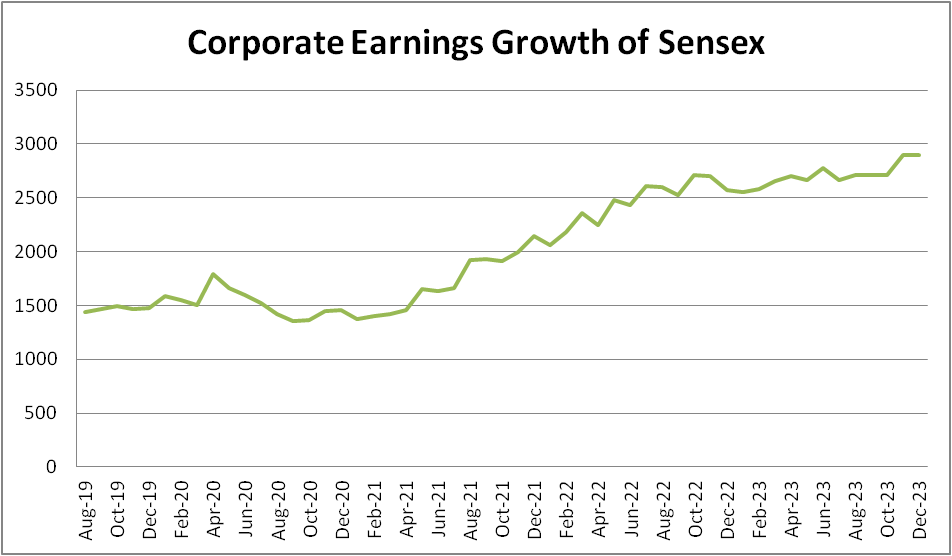
IIP act as a leading indicator in this case. Increased demand in economy is first shown in the IIP Index, and later, corporate earning results follow.
Final words on IIP:-
The IIP is highly positively correlated with the GDP (Gross Domestic Product) growth of the country, so it can be used as a proxy for broader economic growth. All government policies and interest rate cuts are influenced by IIP data, making it valuable for due diligence by investors.
It is also usually seen a strong growth in IIP data indicating to increase in consumption directly or indirectly. So services sector also performs very well during these times, contributing to overall economic prosperity along with the stock market.
Although sometimes there may be errors in measurement or missing data in the calculation of IIP, it still represents a usable correlation.
Talking about what can affect IIP adversely is “Interest Rates”. It is observed that if Interest rates rise “IIP” goes down. The major reason for that is with increase in Interest Rates Cost of Capital for the firms increase.(Firms interest expenses increase for their debts). So industrial activities slows down and it affects adversely to the earnings of the firms.
In addition to IIP, investors can also use data from the Index of Eight Core Industries (ICI) to gauge economic growth and development. Although different from IIP, the methods of calculation for ICI are almost the same, and both have a base year of 2011-2012. While IIP is a broader index, ICI focuses only on eight core sectors: coal, crude oil, natural gas, refinery products, fertilizers, steel, cement, and electricity. Investors can analyze the growth rates of these core sectors and make investment decisions accordingly.
Data for the Index of Eight Core Industries can be accessed from the Office of the Economic Advisor via the following link:-
Preparing a Macroeconomic dash board and tracking the industries can be the wisest way to analyse the trends and opportunities.