Harami Cross Candlestick Pattern

What is the Harami Cross Candlestick pattern?
The Harami Cross Candlestick pattern is a Japanese candlestick pattern that comprises two candles. The first candle is relatively larger and can be either bullish or bearish. It is followed by a Doji candle, which is characterized by its open and close prices being very close to each other. The Doji candle's high and low prices should be contained within the previous candle's range, meaning that they should not cross the body of the preceding candle.
There are two types of Harami Cross patterns: the Bullish Harami Cross, which is typically found in a downtrend, and the Bearish Harami Cross, which is commonly observed in an uptrend.

Bullish Harami Cross Pattern
The Bullish Harami Cross Pattern is a trend reversal candlestick pattern discovered in a downtrend. It comprises two candles: the first candle must be a long bearish candle, and the second candle must be a doji. The doji should form within the previous candle's range.
Understanding the Psychology
When we say that it is found in a downtrend, that means the previous few candles should be bearish, indicating that bears have control. Then, a gap-up opening from the previous candle's close, which happens to be a bearish candle, shows that the bulls are now trying to enter and put an end to the downtrend but couldn't, so they form a doji (which should have wicks on both sides). The doji should not break the open and close of the previous candle, i.e., it should be contained within that candle.
As we know, a doji is marked for indecision among the participants. So, now we will just have to wait for confirmation in the price. If the candle gives a breakout above the high of the pattern, then we can say the bulls have entered. If the candle gives a breakout below the low of the candle, then the first thing is our stop-loss is hit. Second, the downtrend may continue or become range-bound.

Example
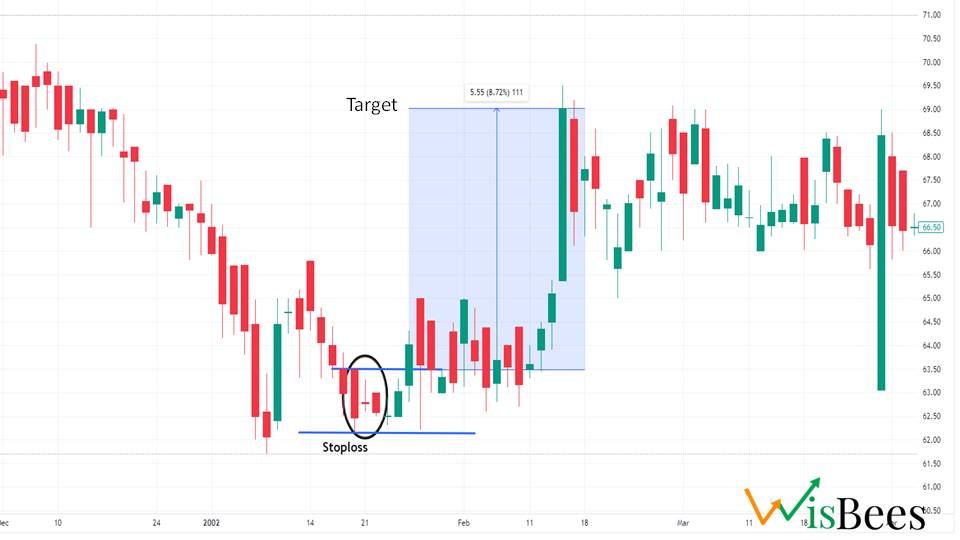
To better understand the concept, we have examined the price chart of HDFC on a daily time frame. As observed in the price chart on January 21, 2002, a bullish harami cross formation occurred. As a trader, the first step is to identify and mark the high and low points of the pattern. In this case, the high of the pattern serves as our entry point, while the low of the pattern becomes our stop loss. Following the breakout, a brief consolidation phase took place, after which the stock experienced an increase of 8.5%.
Bearish Harami Cross Pattern
A bearish harami candlestick pattern is a trend reversal candlestick pattern found in an uptrend. This pattern consists of two candles: the first candle should be a long bullish candle, and the second candle should be a doji. The doji should form within the range of the previous candle, which is the opposite of a bullish harami cross candlestick pattern.
Understanding the Psychology
When we say that it is found in an uptrend, it means the previous few candles should be bullish, indicating that bulls have control. Then, a gap-down opening from the previous candle's close, which happens to be a bullish candle, shows that the bears are now trying to enter and put an end to the uptrend but couldn't, so they end up forming a doji (which should have wicks on both sides). The doji should not break the open and close of the previous candle, i.e., it should be contained within that candle.
As we know, a doji is marked for indecision among the participants. So, now we will just have to wait for confirmation in the price. If the candle gives a breakout below the low of the pattern, then we can say bears have entered. On the other hand, if the candle gives a breakout above the high of the candle, then the first thing is our stop-loss is hit. Secondly, the uptrend may continue or become range-bound as the pattern has been rejected.

Example
We have taken the same stock and the same time frame.
On September 4th, 2008, a bearish harami cross was formed and it was confirmed in the next trading session itself. However, there was a small price correction, but we don't need to worry about it unless that correction hits the stop-loss (SL).
We can clearly see that the price went down by more than 40%.
| Broker | Type | Offerings | Invest |
|---|---|---|---|
 |
Discount Broker | Mutual Funds, Stocks, IPOs, Bonds | Know more |
 |
Discount Broker | Mutual Funds, Stocks, IPOs, Bonds | Know more |
 |
Discount Broker | Mutual Funds, Stocks, IPOs, Bonds | Know more |
 |
Service Broker | Mutual Funds, Stocks, IPOs, Bonds | Know more |


