Bollinger Bands

Introduction
John Bollinger introduced Bollinger Bands in the 1980s. It is one of the most widely used technical indicators, as the name suggests it is a band (over-bought and over-sold situation) within which the prices move.
A Bollinger Band consists of:
- The upper band which is the +2-standard deviation of the middle line
- The middle line which is nothing but a 20-period simple moving average of the closing price
- The lower band is the -2-standard deviation of the middle line
Well, this is the standard setup in most of the terminals also it can be customized by the trader like any other indicator.
How does a BB work?
Let’s take a scenario if you throw a ball toward the ground in an empty room what will happen? As soon as the ball hits the ground it bounces up. Similarly, if you throw the ball toward the ceiling of the room it bounces back and falls.
If you understand this you will understand how a BB works. Whenever the price touches or moves out of the upper band or the lower band there is a high chance that the price will move/bounce back into the band. Some of you might be thinking that, isn’t it resisting the price to move further? Yes, you are right it acts as resistance & support but we consider it as an over-bought and over-sold situation.
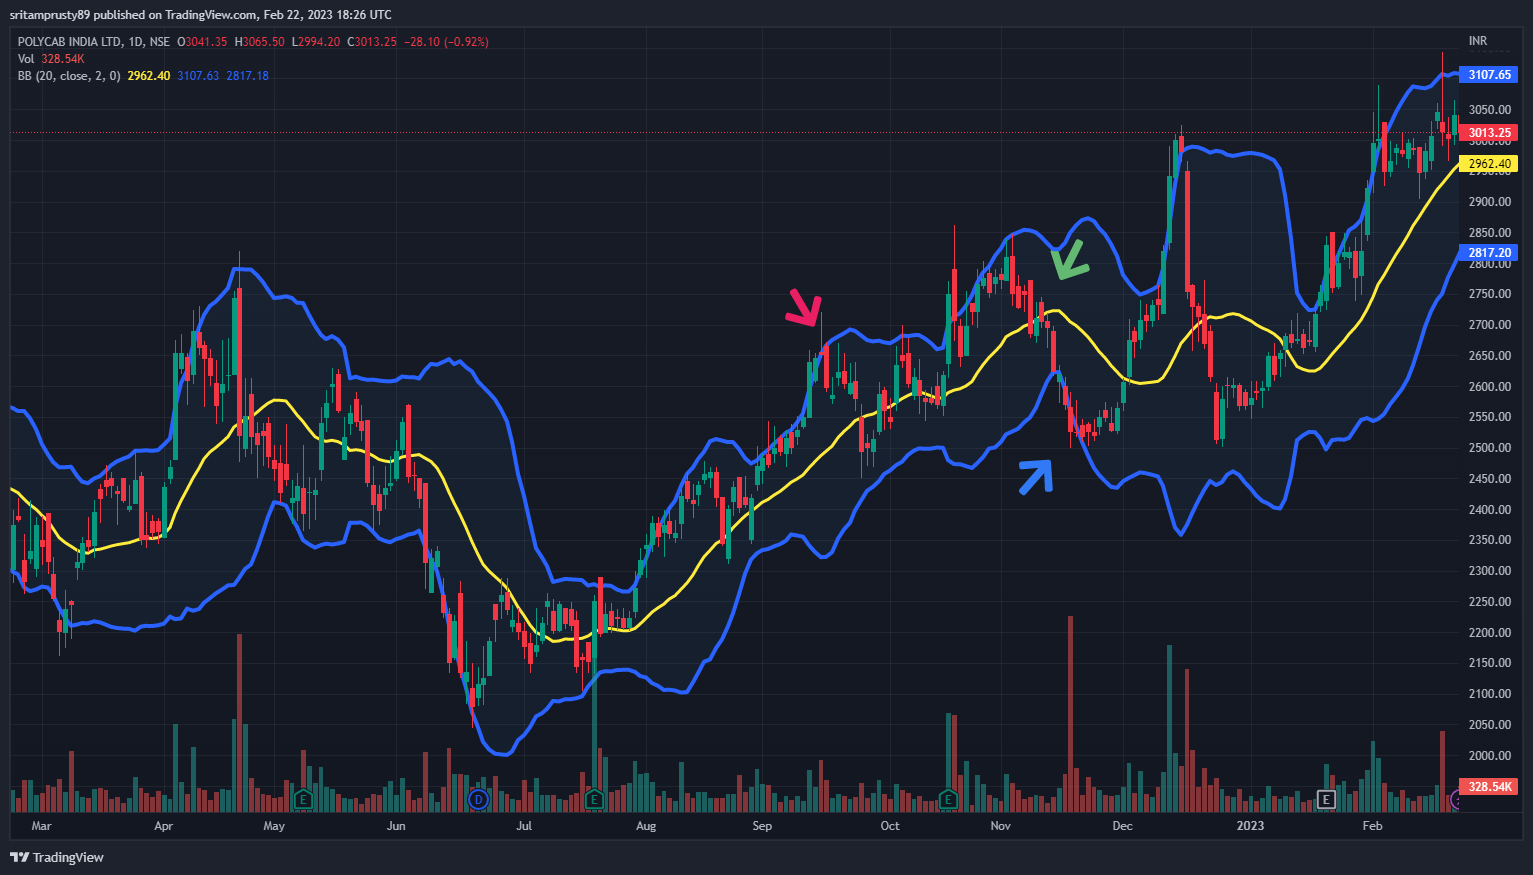
For example, we have taken Polycab India ltd. and you can see the red arrow which shows that on 15th September 2022, the price tries to move above the upper band of BB but it bounced back into the BB. Also, on 18th November 2022, the price tries to move beyond the lower band limit of the BB and in the very next trading session the price moved into the band. Gradually, it started moving till it hit the upper limit of the BB again the cycle repeats.
Advice for traders
When the price reaches either of the ends then you can take an opposite position. If you are a risk taker or else you can wait for the price to confirm by giving a break out on the yellow line which is the 20-period SMA (SMA also acts as support and resistance) and if it doesn’t ‘no trade’. You can see that on 14th November 2022, the price gave a break-out at 2662 and went to 2508 on 22nd November.
Note: Bollinger’s Band is not a standalone trading system but you can use MACD and RSI which will form a good trading system.