The Dow Theory

Introduction
Dow Theory is a fundamental principle of technical analysis used extensively in the Western world, even before the discovery of candlesticks. In fact, the theory was never published by Charles Henry Dow (1851-1902) himself. He was a journalist, founder, and the first editor of the famous "The Wall Street Journal," and the co-founder of Dow Jones and Company. The theory was derived from the 255 articles written by him. After his demise, William Peter Hamilton, Robert Rhea, and E. George Schaefer represented it as Dow Theory.
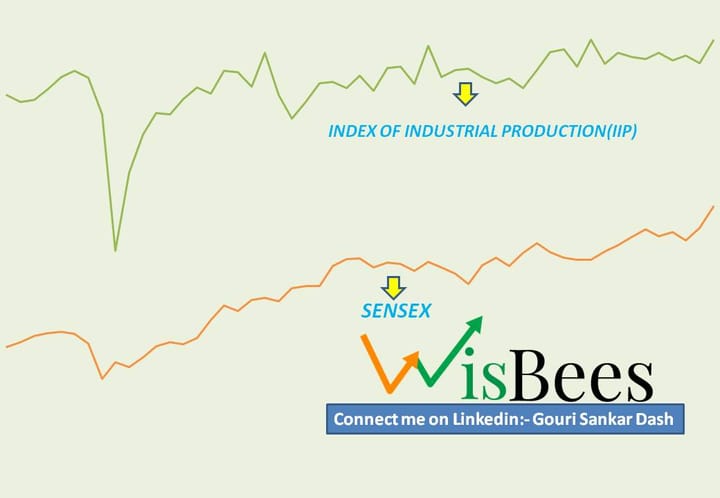
The theory essentially represents how the stock market works and how it is related to the overall economy. He believed that a thorough analysis of the stock market as a whole can suggest the performance of businesses, and the future movements of individual stocks can be predicted. Let's say the indices are performing well in an economy; it means the individual companies that constitute the indices are also doing well because the business conditions in the economy are good. People have buying power, market demand is high, and government policies are conducive to the smooth running of businesses. In short, if someone wants to analyze the economy of the country, they can analyze their stock market indices.
The key tenets of the Dow Theory
The Price / Market Discounts Everything:
The Dow theory is based on the efficient markets hypothesis (EMH), which asserts that asset prices already include all relevant information. In simpler terms, it opposes behavioural economics, implying that everything except for unforeseeable events like natural disasters and political assassinations is already factored into the market prices.
Prices say it all. Market prices tend to react faster than humans to any news hovering in the market. Basically, this tenet tells us that if we only follow the prices of a company or the indices on a monthly or weekly basis, then we can easily analyze their performance.
There Are Three Primary Kinds of Market Trends:
Primary trends are the trends that last for more than a year, giving us the overall direction of the market or the prices, which may be bullish or bearish.
Secondary trends, also known as corrections in the prices, are basically against the primary move and last for a few weeks to a few months.
Lastly, noise, or the short-term fluctuations in the price movements, occurs only for a few days to a few hours and is caused by day traders.
Primary Trends Have Three Phases:
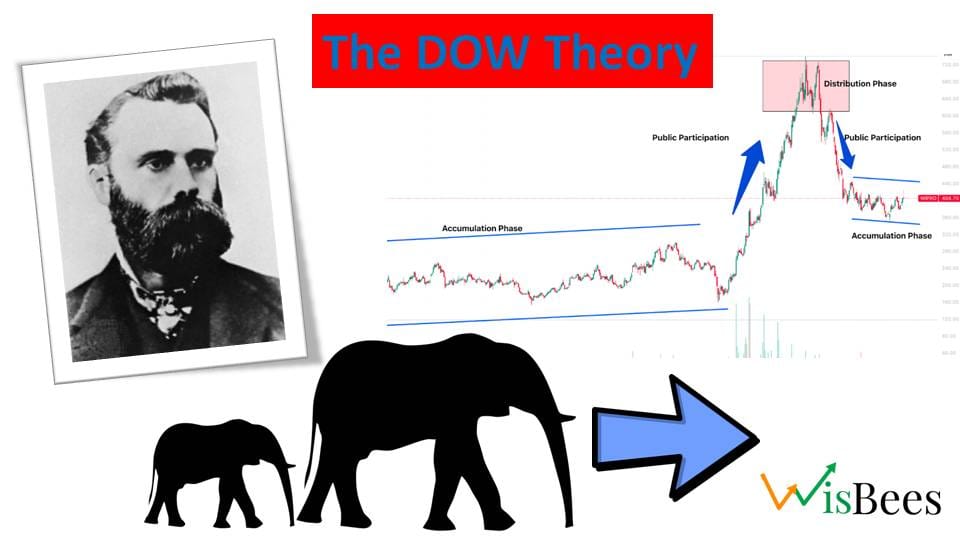
The above chart is of Wipro on a weekly time frame, which shows the three phases of the primary trend. The first one is the accumulation phase. This phase does not indicate any particular direction of the market. In this phase, smart investors start taking long positions (buying the stock) in small quantities, creating a slow and steady demand. They also do not miss out on the bigger rally in the stock and get the maximum return.
Then comes the public participation phase when more and more investors bet on the stock as the increasing price becomes lucrative for individual investors and swing traders, taking the stock higher and higher.
Lastly, the distribution phase indicates that the prices have reached their supply zone, and smart investors or institutional investors start booking their profits.
Similarly, a downtrend also has three phases, which are just the opposite of the uptrend. It starts from the distribution phase where the smart investors have pulled out their money, followed by the public participation phase and accumulation phase, waiting for a new trend to begin.
Indices Must Confirm Each Other:
The overall sentiment of the market cannot be confirmed with just one index. In simple words, if the market is in a bull run, then all the indices will also be in a bull run, making newer highs. In a bull run, only Nifty50 or Nifty IT moving up while Nifty Bank and others going down will never happen; instead, all the indices will perform in a similar fashion.
Dow used Dow Jones Industrial Average (DJIA) and Dow Jones Transportation Average (DJTA) to assume the prevailing business condition.
Volume Must Confirm the Trend:
Volume is the total number of contracts that have been traded in the market during that particular time period. In the above chart, the tall sky-scraper-like figures at the bottom indicate the volume. As it is a weekly candlestick chart, each candle represents the total volume traded in that specific week. Before the beginning of the trend, the continuous high volume confirms the increase in price, indicating that a new trend is coming or has already begun.
Trends Persist Until a Clear Reversal Occurs:
Dow believed that prices moved in a trend irrespective of minor fluctuations due to the daily buying and selling of day traders; it can be a bullish or a bearish trend.
Investors can be easily misled by the secondary trends or price corrections. Remember, in an uptrend, prices always make higher highs and higher lows, and in a downtrend, the prices move, making a lower low and lower highs. So, these higher lows in an uptrend and lower highs in a downtrend are nothing but the secondary trends or price corrections. One cannot consider these corrections as price reversals.
This tenet of Charles Dow states that the secondary trend will be converted into the primary trend in that direction. And this beginning of the new trend should be confirmed by increasing volumes. Lastly, the indices must confirm that the reversal has taken place (they start moving in the same direction).
Key Takeaways
- Market Efficiency: Dow Theory operates on the efficient markets hypothesis, implying that asset prices incorporate all available information, except for unforeseeable events like political assassinations or natural disasters.
- Three Types of Trends: Dow Theory recognizes three primary trends - primary (long-lasting), secondary (temporary corrections), and minor (short-term fluctuations).
- Phases of Primary Trends: Primary trends go through three phases - accumulation (smart investors buy or sell discreetly), public participation (more investors join the trend), and distribution (smart investors start selling).
- Indices Confirmation: The overall market sentiment is confirmed when multiple indices move in the same direction, providing a more accurate picture of the market's health.
- Volume as Confirmation: The trading volume is essential in confirming trend strength; rising prices with higher volume validate a robust trend, while low volume during corrections suggests a weak trend.
- Trends' Persistence: Dow Theory suggests that trends continue until a definitive reversal occurs, and traders must be cautious about mistaking minor fluctuations for trend reversals.
| Broker | Type | Offerings | Invest |
|---|---|---|---|
 |
Discount Broker | Mutual Funds, Stocks, IPOs, Bonds | Know more |
 |
Discount Broker | Mutual Funds, Stocks, IPOs, Bonds | Know more |
 |
Discount Broker | Mutual Funds, Stocks, IPOs, Bonds | Know more |
 |
Service Broker | Mutual Funds, Stocks, IPOs, Bonds | Know more |


