Hammer, Hanging Man & Shooting Star Candlestick Patterns

Hammer or Hanging man
Hammer:
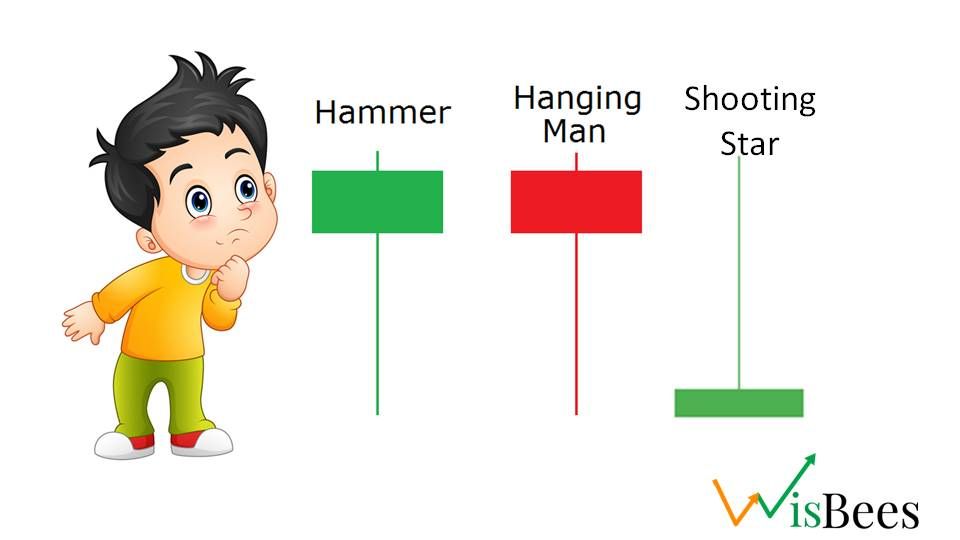
The “Hammer” candlestick pattern is a popular candlestick pattern used by traders to identify potential trend reversals in the market. It is characterized by a small real body (the difference between the opening and closing price) at the top of the candlestick, with a long lower shadow and little to no upper shadow.
The pattern is called a "Hammer" because it looks like a hammer, with the long lower shadow resembling the handle and the small real body resembling the head of the hammer.
The hammer pattern is considered bullish when it appears after a downtrend, as it indicates that the buyers have stepped in and are pushing prices higher. Traders will often look for confirmation of the bullish reversal by waiting for a follow-through day or other bullish signals.
It's important to note that like all technical indicators, the hammer pattern should not be used in isolation and should be used in combination with other technical and fundamental analysis tools to make informed trading decisions.
How to trade a hammer candlestick pattern?
We know that this pattern is generally found at the bottom or the end of the downtrend. If you remember the “Dragonfly Doji” formation there was a long lower wick formed due to the entry of bulls and exit of bears i.e. bears have a weaker hand and face difficulty in dominating the market. The same is the case here this candle is considered the bottom of the trend because the market opened at higher levels and also closed at higher levels but made a low twice as long as the real body.
Whenever you see a candle stick pattern
- First, mark the high and low of the pattern and wait for the price to breach either side of the pattern.
- If the next candle or the subsequent candles closes above the high of the previous candle you can enter into the trade.
- If you are a risk-averse trader then wait for another confirmation by a green candle.
- If you are a risk taker then you can take trade after the first breakout.
Hanging Man:
This looks similar to a “Hammer” pattern. It is a bearish reversal pattern that occurs at the top of an uptrend. It is a single candlestick pattern that is formed when the opening and closing prices are near the top of the candlestick, with a long lower shadow and little or no upper shadow.
The pattern suggests that the bulls (buyers) were in control during the trading session, but the bears (sellers) took over at some point, driving the price down and leaving a long lower shadow. This indicates that the bears have started to gain control and that the trend may be reversing.
Example
As we have discussed earlier, whenever, a hammer is formed at the bottom of a downtrend with all the satisfying conditions. So you can see that on 3rd May 2021, a Hammer pattern was formed at the bottom soon after which the prices went to roofs creating its new life time high within the next 2-3 months.
Shooting Star
The "shooting star" candlestick pattern is a bearish reversal pattern also known as an inverted hammer and occurs at the top of an uptrend. It is formed when the opening and closing prices are near the bottom of the candlestick, with a long upper shadow and little or no lower shadow.
It is a very strong single candle stick pattern whenever it appears at the top of an uptrend the prices tend to fall. The pattern suggests that the bulls were in control during the trading session, pushing the price up, but the bears took over at some point, driving the price down and leaving a long upper shadow. This indicates that the bears have started to gain control and that the trend may be reversing.
Example
Here, we have taken the Manappuram Finance chart on a daily time frame. On 20th July 2021, a shooting star/inverted hammer appeared on a daily time frame and was also confirmed by the very next candle (a red candle). After which it gave a fall of about 25%.
Key Takeaways
- The "Hammer" candlestick pattern is a bullish reversal pattern that can indicate a potential trend reversal in the market. It is characterized by a small real body at the top of the candlestick, with a long lower shadow and little to no upper shadow.
- The "Hanging Man" candlestick pattern is a bearish reversal pattern that occurs at the top of an uptrend. It is characterized by a long lower shadow and little to no upper shadow, with the opening and closing prices near the top of the candlestick.
- The "Shooting Star" candlestick pattern is a bearish reversal pattern that occurs at the top of an uptrend. It is characterized by a long upper shadow and little to no lower shadow, with the opening and closing prices near the bottom of the candlestick.
- These candlestick patterns should not be used in isolation, but in combination with other technical and fundamental analysis tools to make informed trading decisions.
- When trading a hammer candlestick pattern, traders should wait for the price to breach either side of the pattern and look for a follow-through day or other bullish signals as confirmation of the bullish reversal.
- When trading a hanging man or shooting star candlestick pattern, traders should look for a follow-through day or other bearish signals as confirmation of the bearish reversal.


