MOVING AVERAGE CONVERGENCE & DIVERGENCE (MACD)

What is MACD?
MACD is a momentum oscillator showing convergence and divergence between two Moving Averages. It consists of a MACD line, a Signal line/trigger line, and a histogram. Traders use the crossover of the MACD line and the Signal line to enter into a trade or exit a trade.
Components of MACD
The MACD line is nothing but the difference between the 26-period EMA and the 12-period EMA. The Signal Line is the average of the MACD line. MACD histogram is the difference between the MACD line and the Signal Line. Apart from all these, there is another line called the ‘Zero’ line around which the MACD & Signal lines oscillate. The region above the Zero line is the bullish zone and the region below the zero line is the bearish zone.
How do traders use this indicator?
Since it is the convergence and divergence of the moving averages, whenever the MACD line crosses the Signal line and moves up traders can go long. Whenever the MACD line crosses the Signal line and moves downwards traders can go short.
Note: MACD crossover in a bearish zone doesn't need to indicate a bearish move or vice versa. A Bullish crossover (MACD line crossing the Signal line in an upward direction) formed above the zero line has a greater impact than the same crossover in a Bearish zone. A bearish crossover (MACD line crossing the Signal line in a downward direction) formed below the zero line has a greater impact than the same crossover in the Bullish zone.
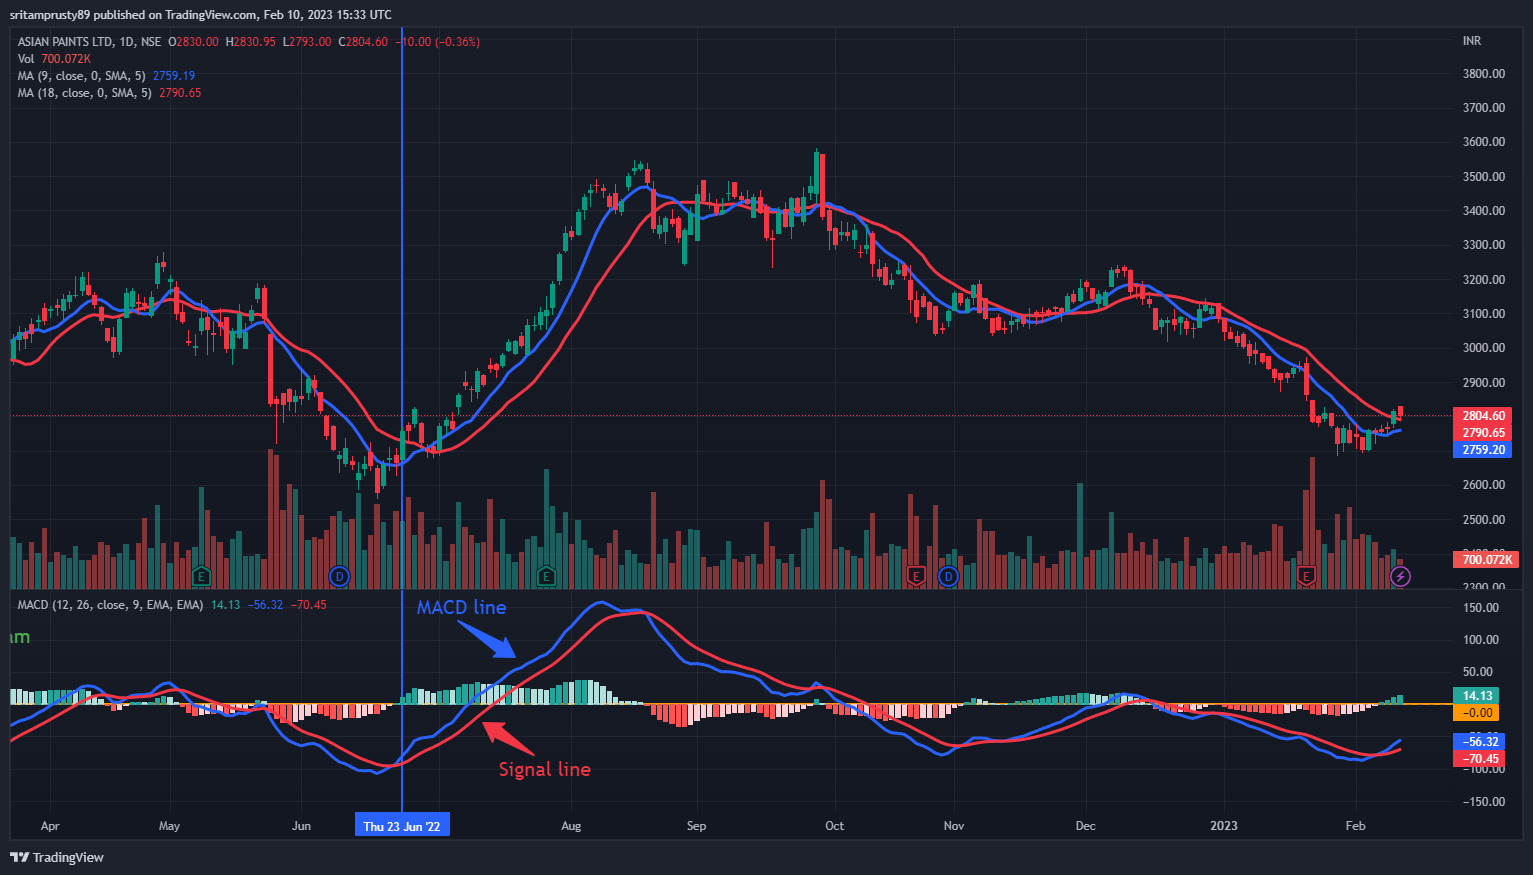
Let’s go to the real charts, here, we have taken Asian Paints Ltd., as we know traders take advantage of the MACD crossover to take trades. The blue line is the MACD line and the red line is the Signal line. If the blue line crosses the red line from the bottom a bullish crossover is formed and vice versa. As shown in the above image on 22nd June 20222 the MACD indicator gave a bullish crossover and you can see the stock rallied till a bearish crossover though it formed in the bullish zone of the MACD there was a small drop in the price. As soon as the MACD line and the Signal line moved below the ‘Zero’ line and entered the bearish zone the price dropped faster.