Decoding Large Cap Funds: Risk, Reward & Real Value
Returns don’t lie, but they don't tell you the whole truth either.
Most people obsess over returns. But great investors know — returns are only half the story. The real question is: how were those returns generated, and what risks were taken to achieve them?
Years of market study have taught me that simply chasing return percentages often leads to poor choices. In fact, many so-called “great” investors have fallen into that exact trap. I know it sounds counterintuitive, but if you're only tracking returns, you're not seeing the full picture.
When I evaluate a mutual fund, I ask myself:
- Am I paying too much for similar returns?
- Am I being fairly compensated for the risk I’m taking?
- How does this fund behave during a market downturn?
- How does it compare across key performance indicators?
I know many of you ask the same. And I’ve seen plenty get even more confused after a 5-minute YouTube explanation. If that sounds familiar, don’t worry — especially if you’re looking at large-cap funds. I’ve done a deep-dive evaluation of India’s top large-cap mutual funds, using a 360° benchmarking model that goes beyond returns to answer how those returns are made, and whether they’re worth the ride.
The Research Framework
To do this, I analyzed funds using eight performance metrics, each answering a different question about return quality, risk, and efficiency.
Rolling Returns
This captures how consistently a fund performs across different time periods — not just one great year. By looking at 1, 3, and 5-year rolling returns, we assess both short-term agility and long-term reliability.
Alpha
Alpha shows whether a fund has outperformed its benchmark after adjusting for risk. A positive alpha = smart fund management. A negative alpha = underperformance despite similar or greater risk.
Sharpe Ratio
This tells us if high returns come with wild swings or smooth sailing. A higher Sharpe Ratio means better risk-adjusted performance — growth without sleepless nights.
Standard Deviation
Measures how volatile a fund is. High deviation means unpredictable results; low means stable, steady growth. Funds with lower deviation were rated higher for offering more peace of mind.
Max Drawdown
The deepest fall a fund has experienced from peak to trough. It helps us understand downside risk — how much you could lose in a bad market. Lower drawdown = better capital protection.
Expense Ratio
This is the annual fee you pay to the fund house. Even a tiny difference can eat into long-term returns due to compounding. Only Direct Plans (not Regular Plans) were considered to present a fairer cost picture.
R² (R-Squared)
Measures how closely a fund mirrors its benchmark. A high R² = predictable performance. Important for large-cap funds that are expected to track the index closely.
Beta
Indicates how much the fund moves relative to the market. A Beta under 1 means lower volatility and stronger downside defense — traits many conservative investors value.
All metrics were normalized on a 0–100 scale and weighted based on importance to deliver a composite score for each fund.
Large-Cap Funds Analyzed
Each fund in this list:
- Invests 80%+ in India’s top 100 listed companies (SEBI-defined large-cap)
- Has at least 5 years of historical data
- Offers only Direct Plans (no commissions or distributor bias)
- Has significant AUM to ensure stability and relevance
Here are the 10 funds we evaluated (in no specific order):
- ICICI Prudential Large Cap Fund – Direct Growth
- Nippon India Large Cap Fund – Direct Growth
- Mirae Asset Large Cap Fund – Direct Growth
- Axis Large Cap Fund – Direct Growth
- Canara Robeco Large Cap Fund – Direct Growth
- Baroda BNP Paribas Large Cap Fund – Direct Growth
- Edelweiss Large Cap Fund – Direct Growth
- Kotak Bluechip Fund – Direct Growth
- HDFC Large Cap Fund – Direct Growth
- SBI Bluechip Fund – Direct Growth
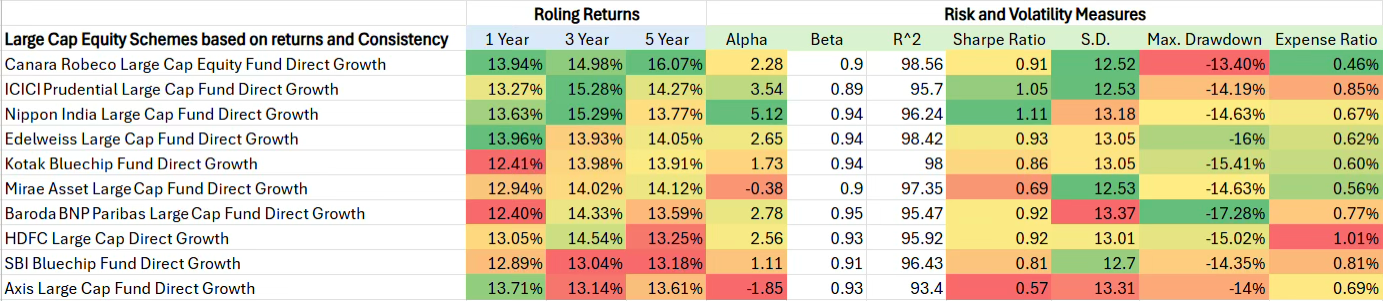
After carefully studying all the funds using multiple performance factors, we noticed some clear differences.
Canara Robeco stood out as the best overall. It gave the highest 5-year returns, stayed consistent over time, had the lowest costs, and protected well during market downturns. Nippon India also performed well with the highest alpha and Sharpe ratio, meaning it delivered strong returns for the risk taken — but it was a bit more volatile. ICICI Prudential and Edelweiss gave good returns too, while keeping risks and costs under control. Kotak Bluechip and Baroda BNP Paribas were average — decent performers but with some downsides like higher losses during market dips or average risk-adjusted returns. On the weaker side, SBI Bluechip and HDFC Large Cap were just okay across most areas. They had higher costs and didn’t really shine in any metric. Mirae Asset, despite being popular, had disappointing numbers with negative alpha and a low Sharpe ratio. Axis Large Cap ranked the lowest. It had the worst alpha, poor returns for the risk taken, and the highest ups and downs — making it a weak choice based on current data. Edelweiss, on the other hand, stood out for its low cost and strong ability to protect capital during tough times.
We have further normalised each of these metrics between 0 and 100 and assigned them weights.
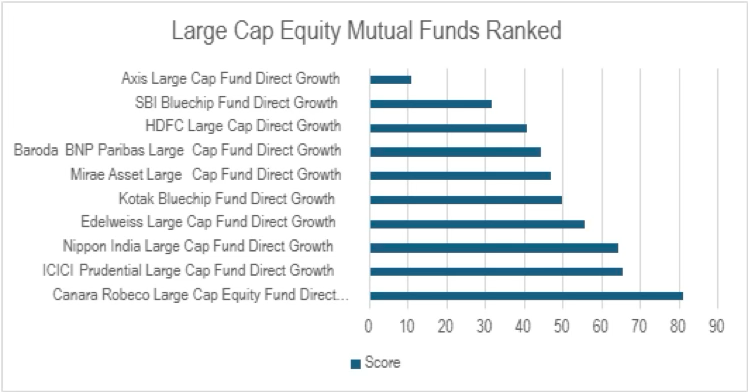
Based on these weights we have scored them and assigned them ranks. The ranks suggest that Canara Robeco Large Cap is the best performer in the category based on the given metrics followed by ICICI Prudential Large Cap and Nippon India Large Cap funds.
Based on the above data, we created a radar chart. This chart offers an at-a-glance comparison that shows not just how well each fund performs, but where its strengths and weaknesses lie — helping investors choose based on what they value most: cost-efficiency, stability, consistency, or aggressive outperformance.
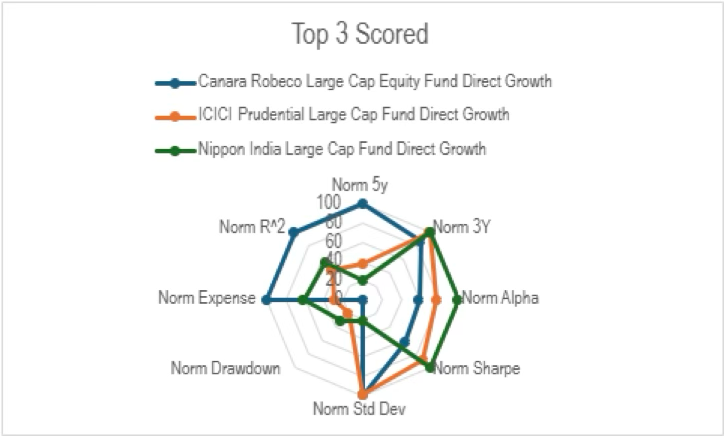
The radar chart above visually summarizes the performance of the top three large-cap funds — Canara Robeco, ICICI Prudential, and Nippon India across all the eight critical, normalized metrics. Each axis represents a key performance indicator (like 5-year returns, alpha, Sharpe ratio, expense ratio, etc.), scaled from 0 to 100. A broader coverage on the radar means stronger, more well-rounded performance.
In this chart, Canara Robeco clearly dominates, with consistently high scores across almost all dimensions — particularly in 5Y returns, R² (benchmark alignment), expense ratio, and drawdown protection. Nippon India stands out for its impressive alpha and Sharpe ratio, highlighting strong active management and solid risk-adjusted returns, though it compromises slightly on volatility and drawdown. ICICI Prudential has a balanced profile, doing reasonably well in most areas but notably dips on standard deviation and drawdown, suggesting higher volatility.
In Short
- Returns are Just the Beginning: High returns often catch the eye, but this research shows they are only part of the story. Risk-adjusted metrics like Sharpe Ratio, Alpha, and Max Drawdown reveal how reliable and sustainable those returns truly are.
- Consistency Beats Flashiness: Canara Robeco Large Cap Fund outperformed not just on returns, but also on cost-efficiency, stability, and downside protection. This highlights the importance of steady, consistent growth over volatile highs and lows.
- Every Fund Has a Personality: Nippon India stood out for bold, high-alpha performance, while ICICI Prudential showcased balance. Understanding your risk tolerance helps you match with a fund that aligns with your investment temperament.
- Brand Names Don't Equal Great Funds: Popular choices like Mirae Asset and Axis Large Cap underwhelmed when tested across all metrics. Reputation shouldn’t replace data-backed analysis when selecting a fund.
- Invest in What Suits You, Not What Sells: Conservative investors may lean towards funds like Canara Robeco or Edelweiss. Aggressive investors might explore Nippon India or Kotak. This analysis empowers each type of investor with clear data to align choices with goals and comfort levels.
Who Should Invest in What?
The answer to this lies in what kind of investor you are. Don’t be a part of the herd just because it feels safe to do so; it is important for every investor to introspect and understand what amount of risk they can digest. We have made some suggestions below based on Five broad investor criteria – conservative, moderately conservative, moderate, moderately aggressive and aggressive.
Conservative
If you’re someone who values peace of mind over brag-worthy returns, Canara Robeco and Edelweiss might just be in your comfort zone. They don’t try too hard to impress; they quietly deliver. Low cost, low drawdown, and dependable performance even when markets get moody. For those who’d rather sleep soundly than chase every rally.
Moderately Conservative
If you are okay with a bit of movement as long as the trade-off is worth it. ICICI Prudential fits in the middle ground. It doesn’t lead in any one area, but it does most things right: decent consistency, reasonable cost, and no major red flags. The kind of fund that earns your trust over time is important.
Moderate
If you don’t mind some noise as long as the music plays well. Kotak Bluechip and Baroda BNP Paribas aren’t flashy, but they’re balanced. They give you a fair shot at growth without dragging you into uncomfortable territory. Good for investors who want to grow without guessing.
Moderately Aggressive
If you want the upside — and you’re prepared to earn it. Nippon India fits that mould. Its Alpha and Sharpe Ratio are top tier, but it won’t hold your hand during rough patches. This one rewards confidence and a bit of resilience.
Aggressive
If your style is to run when others walk, you’ll be tempted by funds like HDFC and SBI Bluechip. But be aware: high cost, average metrics, and not enough payoff for the risk. As for Axis Large Cap, the numbers speak for themselves. It ranks the lowest in nearly every dimension. Aggressiveness is one thing; unreliability is another.
Final Word
At the end of the day, investing isn’t about finding the best fund, it’s about finding your best fit. The market will always have winners and losers, but the real question is: what works best for you? This research isn’t about crowning a single champion; it’s about showing you how to read the full story behind a fund, not just the headline returns. Whether you're a cautious investor looking to protect capital or a bold one chasing alpha, this framework can help you ask the right questions and make better choices. Because in the long run, it’s not about timing the market or chasing fads. It’s about building conviction, staying informed, and investing in what aligns with your goals and your temperament.
Let the data guide you — not the noise.